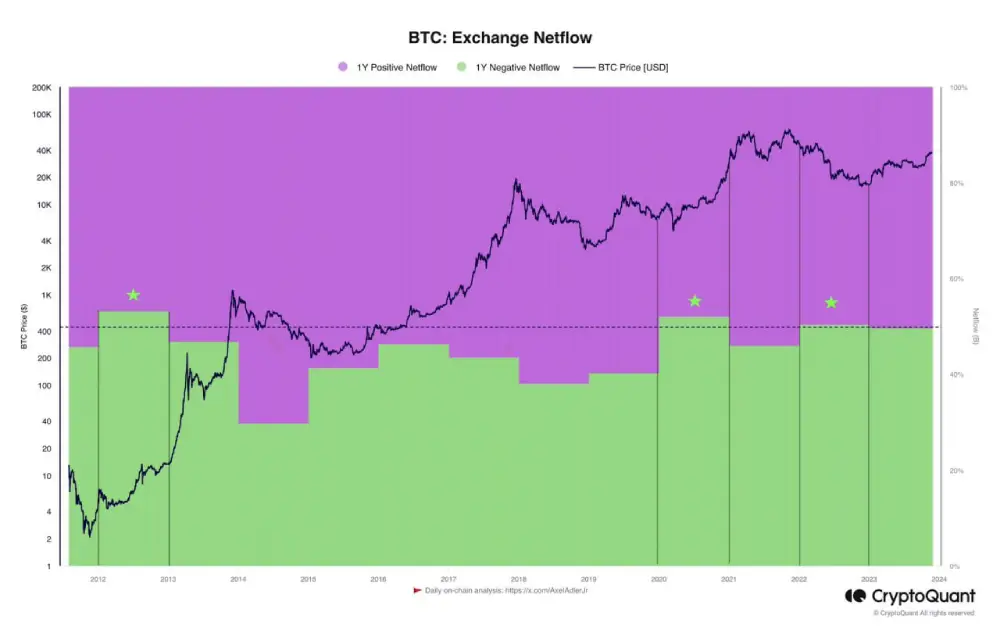
This graph shows the change in buying and selling preferences over 12 years. The last 4 years have been dominated by purchases. As soon as the price becomes > $50K, according to the chart, we will be able to see the real situation in terms of selling pressure.
Our Social Networks :
X.com
Telegram
Facebook
Instagram
You can register in 🔸BINANCE🔸 and get good bonuses with us(100$)!!!